

Posted on 27 July 2023.
Memory Space in OpenJDK 17
OpenJDK 17 includes several memory spaces used by the Java Virtual Machine (JVM) to manage memory for Java applications. Understanding these different memory spaces can help developers optimize their Java applications for Kubernetes environments.
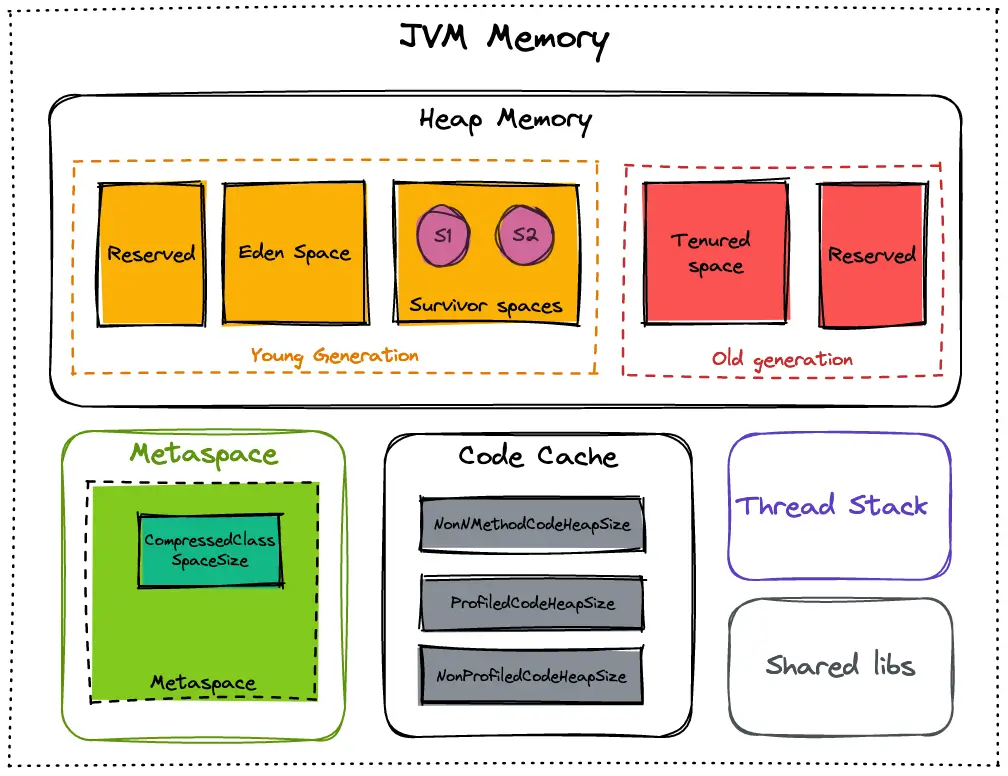
Heap Memory
The heap space is where objects created by Java applications are stored. It is the most important memory space for Java applications. In OpenJDK 17, the default heap size is calculated based on the available physical memory and is set to 1/4th of the memory available.
Young Generation
The young generation is where new objects are created, and short-lived ones are stored. It is divided into two spaces: the Eden space and the survivor space. The first one is where new objects are created, while the second one is where objects that have survived one garbage collection cycle are moved.
Old Generation
The old generation, also known as the tenured generation, stores long-lived objects. Those that have survived Some garbage collection cycles are moved from the young to the old generation.
Metaspace
The non-heap space is used by the JVM to store metadata and class definitions. It is also known as the permanent generation (PermGen) in older versions of Java. In OpenJDK 17, the PermGen space has been replaced by a new Metaspace, which is designed to be more efficient and flexible.
Code Cache
The code cache is used by the JVM to store compiled code generated by the Just-In-Time (JIT) compiler.
Thread Stack Space
Each thread in a Java application has its own stack space, which is used to store local variables and method calls. The size of the thread stack can be configured using the -Xss JVM option.
Shared libs
The shared libraries space (also known as the shared class data space) in Java JVM is a memory space used to store shared class metadata and other data structures. This memory space is shared across multiple Java processes. This allows various Java applications running on the same machine to share the same copy of the class metadata and other data structures.
The purpose of the shared libraries space is to reduce memory usage and improve performance by avoiding duplicate copies of the same class metadata. When multiple Java processes use the same class metadata, they can share the same copy of that metadata, which reduces memory usage and improves startup times for the applications.
Why should you fine-tune the memory setting of your JVM?
The default behavior of the JVM will lead to a lot of troubles on Kubernetes. As we saw before, the Heap is set by default to ¼ of the available memory. Since the JVM will take into account the maximum memory available for the pod (the limits apply), the size of the heap could be bigger than you want. More, other default values will be applied to other spaces, such as the Code Cache or Metaspace.
If you look at the maximum usable memory from the perspective of the JVM, it will be greater than the maximum you provided to your pod. That will lead to many Out Of Memory for your application (on the Kubernetes part).
Avoid OOM on Kubernetes for your Java Application
Most of the time, it’s all about fine-tuning your JVM. Since we saw that there are different memory space involved in the JVM, we have to set each of these spaces with a specific size. That will help us to calculate more precisely the memory limits for your pods.
Here is a schema that shows the options available for each memory space:
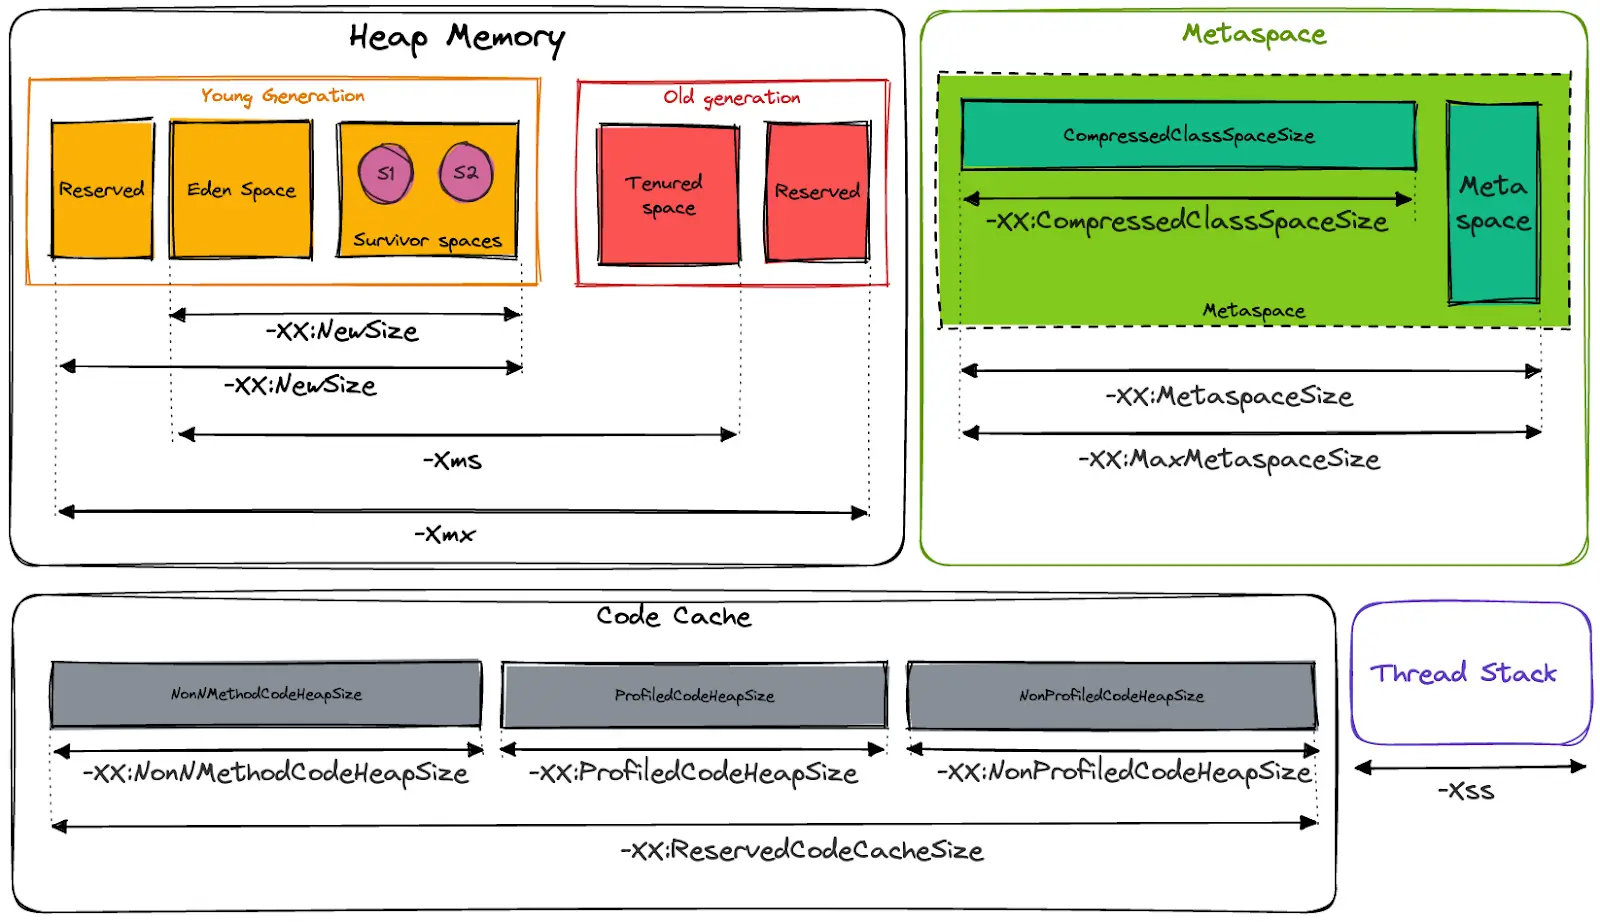
The basic formula is :
Heap + Metaspace + Code Cache
Which means :
-XmX + -XX:MaxMetaspaceSize + -XX:ReservedCodeCacheSize
Since the number of thread depends on the context of your application, we recommend adding some “buffer” memory for this part. Thread stacks are set to a maximum of 1MB by default.
If you want to handle heap dump from your JVM, you need to add the size of your heap as an “extra” memory available a second time.
Finally, the formula to set the Limits of your pods is:
(-XmX * 2) + -XX:MaxMetaspaceSize + -XX:ReservedCodeCacheSize + SomeBuffer
The buffer part depends on your context, 128 MB should be fine to start.
Helm templating
Since you have your formula, you can automatically calculate the Requests and Limits of your pod with a bit of Helm templating. It’s also a good idea to empower your developer with a simple interface to set the different parameters without worrying about the Pods settings.
Here is an example of the default value for your chart :
jvm:
 garbageCollector: -XX:+UseG1GC
 # values in Mi
 memory:
   heap: 128
   metaspace: 256
   compressedClassSpaceSize: 64
   nonMethodCodeHeapSize: 5
   profiledCodeHeapSize: 48
   nonProfiledCodeHeapSize: 48
   buffer: 128
I use a Helper to set the JAVA_TOOL_OPTIONS :
{{/*
JVM customisation
*/}}
{{- define "chart.javaToolOptions" -}}
-Xms{{.Values.jvm.memory.heap}}m -Xmx{{.Values.jvm.memory.heap}}m -XX:MetaspaceSize={{.Values.jvm.memory.metaspace}}m -XX:MaxMetaspaceSize={{.Values.jvm.memory.metaspace}}m -XX:CompressedClassSpaceSize={{.Values.jvm.memory.compressedClassSpaceSize}}m -XX:+TieredCompilation -XX:+SegmentedCodeCache -XX:NonNMethodCodeHeapSize={{.Values.jvm.memory.nonMethodCodeHeapSize}}m -XX:ProfiledCodeHeapSize={{.Values.jvm.memory.profiledCodeHeapSize}}m -XX:NonProfiledCodeHeapSize={{.Values.jvm.memory.nonProfiledCodeHeapSize}}m -XX:ReservedCodeCacheSize={{ add .Values.jvm.memory.nonMethodCodeHeapSize .Values.jvm.memory.profiledCodeHeapSize .Values.jvm.memory.nonProfiledCodeHeapSize}}m{{- end -}}
That I use in my deployment.yaml file :
- name: {{ include "chart.name" . }}
         image: "{{ .Values.container.image.repository }}:{{ .Values.container.image.tag }}"
         env:
           - name: JAVA_TOOL_OPTIONS
             value: {{ include "chart.javaToolOptions" . }}
And I automatically configure memory Requests and Limits based on the provided parameters :
resources:
           limits:
             memory: {{ add .Values.jvm.memory.heap .Values.jvm.memory.heap .Values.jvm.memory.metaspace .Values.jvm.memory.nonMethodCodeHeapSize .Values.jvm.memory.profiledCodeHeapSize .Values.jvm.memory.nonProfiledCodeHeapSize .Values.jvm.memory.buffer | printf "%dMi"}}
             cpu: {{ .Values.container.resources.limits.cpu }}
           requests:
             memory: {{ add .Values.jvm.memory.heap .Values.jvm.memory.metaspace .Values.jvm.memory.nonMethodCodeHeapSize .Values.jvm.memory.profiledCodeHeapSize .Values.jvm.memory.nonProfiledCodeHeapSize | printf "%dMi"}}
             cpu: {{ .Values.container.resources.requests.cpu }}
Results
With this setting, we have reduced the number of Out Of Memory errors on Kubernetes side to zero. Now, the JVM will OOM on his side and generate a heap dump that will help the developers to analyze the memory. They will find out if there are some optimizations to push or if we need to increase the heap size (or other memory space).
By fine-tuning the JVM memory configuration, we break the evil loop, where each OOM implied adding memory for the pod to avoid a future issue. We better understand each memory space and how and when to increase them.

Fine-tuning needs measurement, so we recommend you to have some tools, like Micrometer, to have some metrics about the JVM usage.
And, the cherry on the cake, we have reduced the memory requirement of our applications and de facto reduce the cost of the infrastructure by reducing the waste of memory! Good for the money and good for the planet.